The Film Room · Running Backs · Week 11
Week 11 RB Film Room: Earned Yards vs. Handed Carries
Carries Get Handed Out. Yards Get Earned. Trust the Earners.
Some backs gain more than anybody should with the ball they're given. Others get the ball and do nothing with it. Here's who to play in Week 11.

By Mohn Jadden · Week 11 · Stats through Week 10
A carry is a decision. The yard after it is a result. Coaches make the first one, and runners make the second.
The league tracks how many more yards a back gains than a typical runner would. Same blocking, same defenders. We lined that up against how much of his team's rushing he gets. A few of these fellas are earning it for nobody. Others are being handed it and doing nothing with it.
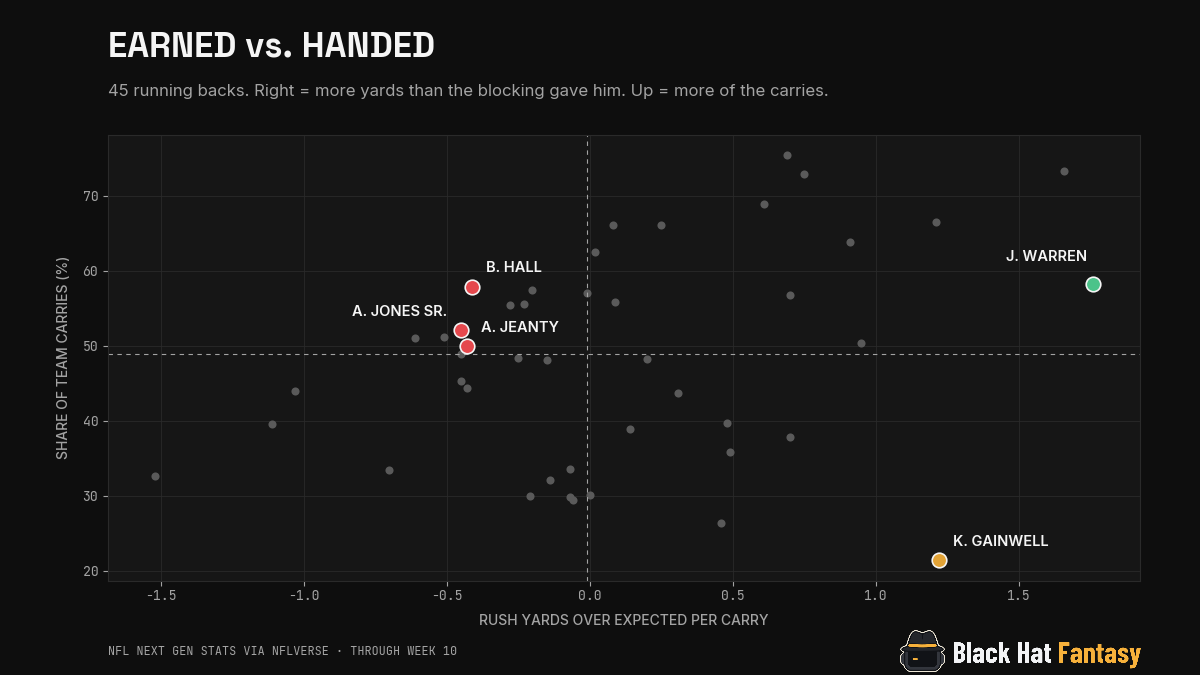
See all 45 players as a table
| # | Player | Team | Rush yards over expected per carry | Share of team carries (%) |
|---|---|---|---|---|
| 1 | Jaylen Warren | PIT | 1.76 | 58.3 |
| 2 | Kenneth Walker III | KC | 1.66 | 73.3 |
| 3 | Kenny Gainwell | TB | 1.22 | 21.4 |
| 4 | Bijan Robinson | ATL | 1.21 | 66.5 |
| 5 | Braelon Allen | NYJ | 0.95 | 50.4 |
| 6 | James Cook III | BUF | 0.91 | 63.8 |
| 7 | Chuba Hubbard | CAR | 0.75 | 72.9 |
| 8 | Saquon Barkley | PHI | 0.7 | 37.9 |
| 9 | Bucky Irving | TB | 0.7 | 56.8 |
| 10 | Jahmyr Gibbs | DET | 0.69 | 75.4 |
| 11 | Tony Pollard | TEN | 0.61 | 68.9 |
| 12 | Blake Corum | LAR | 0.49 | 35.8 |
| 13 | Tyler Allgeier | ARI | 0.48 | 39.7 |
| 14 | Samaje Perine | CIN | 0.46 | 26.4 |
| 15 | Christian McCaffrey | SF | 0.31 | 43.7 |
| 16 | Javonte Williams | DAL | 0.25 | 66.1 |
| 17 | Kyren Williams | LAR | 0.2 | 48.3 |
| 18 | Rhamondre Stevenson | NE | 0.14 | 38.9 |
| 19 | Cam Skattebo | NYG | 0.09 | 55.8 |
| 20 | Derrick Henry | BAL | 0.08 | 66.1 |
| 21 | Jonathan Taylor | IND | 0.02 | 62.5 |
| 22 | TreVeyon Henderson | NE | 0.0 | 30.1 |
| 23 | Ollie Gordon II | MIA | -0.01 | 57.0 |
| 24 | Rachaad White | WAS | -0.06 | 29.4 |
| 25 | Rico Dowdle | PIT | -0.07 | 33.6 |
| 26 | Brian Robinson Jr. | ATL | -0.07 | 29.9 |
| 27 | Mike Washington Jr. | LV | -0.14 | 32.1 |
| 28 | Omarion Hampton | LAC | -0.15 | 48.1 |
| 29 | Chase Brown | CIN | -0.2 | 57.4 |
| 30 | Kaelon Black | SF | -0.21 | 30.0 |
| 31 | Bhayshul Tuten | JAX | -0.23 | 55.6 |
| 32 | Jordan Mason | MIN | -0.25 | 48.4 |
| 33 | Quinshon Judkins | CLE | -0.28 | 55.5 |
| 34 | Breece Hall | NYJ | -0.41 | 57.9 |
| 35 | David Montgomery | HOU | -0.43 | 44.4 |
| 36 | Ashton Jeanty | LV | -0.43 | 50.0 |
| 37 | Aaron Jones Sr. | MIN | -0.45 | 52.1 |
| 38 | Jacory Croskey-Merritt | WAS | -0.45 | 45.3 |
| 39 | Woody Marks | HOU | -0.45 | 48.9 |
| 40 | D'Andre Swift | CHI | -0.51 | 51.2 |
| 41 | Jeremiyah Love | ARI | -0.61 | 51.0 |
| 42 | Jadarian Price | SEA | -0.7 | 33.5 |
| 43 | J.K. Dobbins | DEN | -1.03 | 44.0 |
| 44 | Kendre Miller | DAL | -1.11 | 39.6 |
| 45 | MarShawn Lloyd | GB | -1.52 | 32.6 |
Top right is where you want to live. Earning it and getting handed it. Bottom right is the guy who earns it and doesn't get the ball. Top left is the opposite, and that's where the trouble hides.
Start Jaylen Warren, because nobody gains more with the ball
- Season
- 16.7 a gameRB10 of 96
- Last 3
- 15.7 a game
- Matchup
- PHI is #25 of 32tough for RBs (1 = softest)
- Rostered
- 96%started in 89%
- Tough matchup
- Usage down
- Steady
- 1.76 rush yds over expected per carry · #1 of 51
- 58.3% of team carries
- 214.2 total rush yds over expected
Now here's a guy. Jaylen Warren.
Out of 51 backs, nobody gains more than a typical runner would in the same spot. He's first. That's the number I trust.
The worry is the carries. Last game he got seven and ran for 15 yards. Over the last three, he's down to 47 percent of Pittsburgh's rushes from 58 percent for the year. Five catches on six targets kept that day alive.
Here's why I don't panic. In Week 3 and Week 4 he got 17 carries each and turned them into 20.6 and 15.6. Give this fella the ball and something happens. Coaches notice that.
Philadelphia is rough on backs, 25th of 32. Pittsburgh is favored by 4.5, though, with 21.5 points expected. A team with a lead hands it off.
Look at the floor. His worst game all year was 9.1. The leagues starting him have it right.
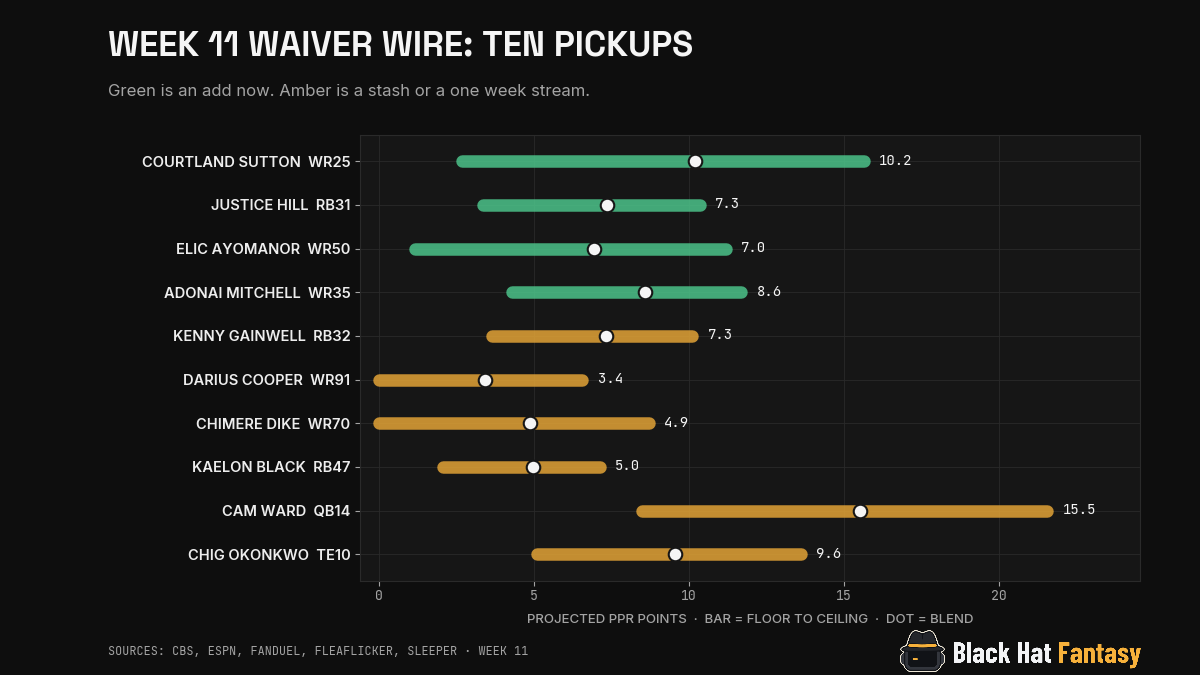
Add Kenny Gainwell now and bench him this week
- Season
- 7.1 a gameRB42 of 96
- Last 3
- 11.1 a game ▲
- Matchup
- DET is #31 of 32tough for RBs (1 = softest)
- Rostered
- 44%started in 9%
- Tough matchup
- Heating up
- Usage up
- Low team total
- Big underdog
- Boom or bust
- 1.22 rush yds over expected per carry · #3 of 51
- 21.4% of team carries
- 76.7 total rush yds over expected
Fewer than one in ten leagues are starting Kenny Gainwell. More than four in ten have him rostered anyway.
Third of 51 in earning his yards. Only about a fifth of Tampa's carries, though. You can't gain yards on carries you don't get.
That's changing. His last three games put him at 30 percent of the carries, and the scores went 8.8, 14.0 and 10.6. In Week 8 he ran 25 times for 140 yards. A coach doesn't hand a guy 25 for fun. Week 7 was 14 carries for 88 yards. Then Week 9 went back to five carries, so the role isn't locked yet.
Now the bad news. Detroit is 31st of 32 against running backs, as tough as it gets. Tampa is a seven-point underdog and only expected to score 18.2. The blend has him at 7.23 and RB32.
So don't play him Sunday. Stash him and let the carries keep creeping.
Sit Ashton Jeanty, whose floor is all catches
- Season
- 15.0 a gameRB16 of 96
- Last 3
- 9.2 a game ▼
- Matchup
- DEN is #11 of 32middle for RBs (1 = softest)
- Rostered
- 97%started in 87%
- Slumping
- Usage down
- Low team total
- Big underdog
- Steady
- -0.43 rush yds over expected per carry · #41 of 51
- 50.0% of team carries
- -52.4 total rush yds over expected
Ashton Jeanty has 46 catches. That's the only reason this isn't uglier.
On the ground, he gets less than the blocking hands him. He's 41st of 51. For a while it didn't matter, because Las Vegas kept feeding him. He's held half the team's carries for the season.
These days it's 28 percent. The scores slid with it. 10.3, 7.0, 10.4, against a 15.0 average. His 32.7 in Week 1 is propping up that average.
Look at the carries by week. 23, 21 and 19 to open the season. Two in Week 8. Nine last week. That's a back losing his job one handoff at a time.
Sunday is Denver, a middle matchup, 11th of 32. Las Vegas is a ten-point underdog. The team total is 15.2. Trailing teams throw, and that keeps the catches coming. It also means fewer handoffs for a runner who isn't winning them.
Almost nine in ten leagues start him anyway.
Sit Aaron Jones Sr., and take ESPN's side
- Season
- 10.6 a gameRB30 of 96
- Last 3
- 7.2 a game ▼
- Matchup
- SF is #23 of 32middle for RBs (1 = softest)
- Rostered
- 80%started in 46%
- Slumping
- Usage down
- Under-started
- -0.45 rush yds over expected per carry · #42 of 51
- 52.1% of team carries
- 126 carries
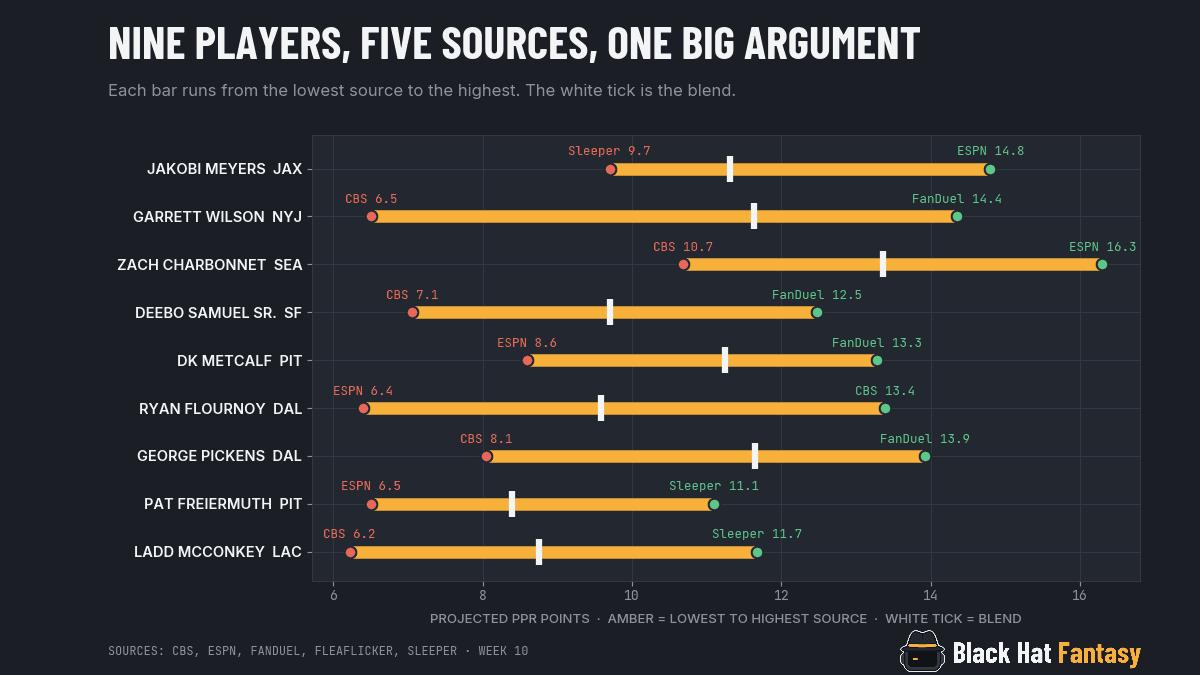
FanDuel says Aaron Jones Sr. is a back you can start. ESPN says he's a body for your bench. I'm with ESPN.
He's 42nd of 51 at earning his yards. The carries were covering for that. He's had 52 percent of Minnesota's rushes for the year. Lately, it's 35 percent.
The first five games were a different man. He had 25 carries for 113 yards against New Orleans and cracked 14 points three times. Since then he's had 11 carries or fewer every game.
The scores tell the story. 6.0, 3.1, 12.5. That last one came with a touchdown. Touchdowns come and go, and a guy who loses yards per carry can't count on one.
San Francisco is the matchup, 23rd of 32. Minnesota is a three-point underdog, but the share is the problem. He's got a floor of 3.08 and little else.
Fewer than half of leagues start him. Join the other half.
Start Breece Hall, and yes, this one cuts against me
- Season
- 13.8 a gameRB19 of 96
- Last 3
- 11.7 a game
- Matchup
- LAC is #12 of 32middle for RBs (1 = softest)
- Rostered
- 94%started in 80%
- Steady
- -0.41 rush yds over expected per carry · #39 of 51
- 57.9% of team carries
- -31.0 total rush yds over expected
This is the one that keeps the argument honest.
Breece Hall is 39th of 51 at earning yards. He loses yards against what the blocking gives him. By my own rule, I should be selling him. I can't.
He's handed the ball. About 59 percent of the Jets' carries lately, and it's been that way all year. In five games, his worst was 8.5. He's never been a dud, and he's startable in four of five.
The last three have gone 8.5, 11.7 and 14.8, so he's climbing. Los Angeles is a middle matchup, 12th of 32, and New York is a three-point underdog, and 19.2 is the team total.
Week 1 tells you who he is. 22 carries, 102 yards, a touchdown, 19.8 points. That's volume doing the work.
Volume is a floor. It isn't a ceiling. That's why the argument lives with Warren and not here. Eight of every ten leagues play him. Correct.
Two more, real quick
- Saquon Barkley, Philadelphia. He's 10th of 51 at earning yards with only 38 percent of the carries. The last three went 15.1, 12.4 and 8.2, and he plays just 37 percent of the snaps. Philadelphia is a 4.5-point underdog at home, with a team total of 17.0. Hold.
- Tyler Allgeier, Arizona. He's 15th of 51 and carries 60 percent of the load over the last three. Then look at the scores. 36.1, then 6.6, then 1.4. At Kansas City, Arizona is a 15.5-point underdog expected to score 12.5. Sit.
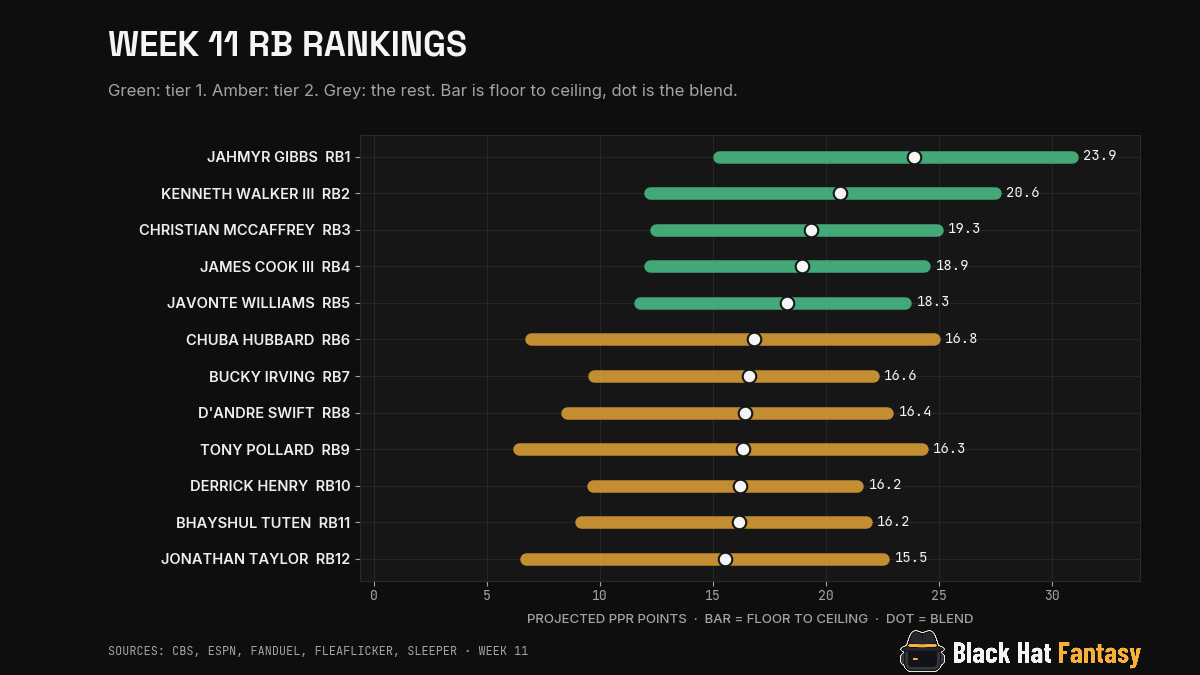
Week 11 RB rankings, top 36
These are the blended projections for this week, in PPR scoring. The range is each player's floor to ceiling.
| Rank | Player | Team | Opp | Proj | Range | Status |
|---|---|---|---|---|---|---|
| RB1 | Jahmyr Gibbs | DET | TB | 23.9 | 15.3 to 30.9 | |
| RB2 | Kenneth Walker III | KC | ARI | 20.6 | 12.0 to 27.6 | Questionable |
| RB3 | Christian McCaffrey | SF | MIN | 19.4 | 12.5 to 24.9 | |
| RB4 | James Cook III | BUF | MIA | 18.9 | 12.2 to 24.4 | |
| RB5 | Javonte Williams | DAL | TEN | 18.3 | 11.8 to 23.5 | |
| RB6 | Chuba Hubbard | CAR | BAL | 16.8 | 7.0 to 24.8 | |
| RB7 | Bucky Irving | TB | DET | 16.6 | 9.8 to 22.1 | |
| RB8 | D'Andre Swift | CHI | NO | 16.4 | 8.7 to 22.6 | |
| RB9 | Tony Pollard | TEN | DAL | 16.3 | 6.5 to 24.2 | |
| RB10 | Derrick Henry | BAL | CAR | 16.2 | 9.7 to 21.4 | |
| RB11 | Bhayshul Tuten | JAX | NYG | 16.2 | 9.2 to 21.8 | |
| RB12 | Jonathan Taylor | IND | HOU | 15.5 | 6.8 to 22.5 | |
| RB13 | Chase Brown | CIN | WAS | 15.3 | 7.7 to 21.4 | |
| RB14 | Jaylen Warren | PIT | PHI | 14.8 | 9.3 to 19.1 | |
| RB15 | Jonah Coleman | DEN | LV | 14.4 | 4.8 to 22.0 | |
| RB16 | Cam Skattebo | NYG | JAX | 14.1 | 6.6 to 20.1 | |
| RB17 | Omarion Hampton | LAC | NYJ | 13.0 | 5.5 to 18.9 | |
| RB18 | David Montgomery | HOU | IND | 12.8 | 4.7 to 19.2 | |
| RB19 | Breece Hall | NYJ | LAC | 12.5 | 6.9 to 16.9 | |
| RB20 | Ollie Gordon II | MIA | BUF | 12.0 | 3.5 to 18.7 | |
| RB21 | Saquon Barkley | PHI | PIT | 11.9 | 4.9 to 17.4 | |
| RB22 | Ashton Jeanty | LV | DEN | 11.9 | 7.2 to 15.6 | |
| RB23 | Emmett Johnson | KC | ARI | 11.5 | 3.2 to 18.0 | |
| RB24 | Tyler Allgeier | ARI | KC | 9.4 | 2.2 to 14.9 | |
| RB25 | Rachaad White | WAS | CIN | 9.1 | 2.7 to 14.1 | |
| RB26 | Aaron Jones Sr. | MIN | SF | 8.9 | 3.1 to 13.3 | |
| RB27 | Travis Etienne Jr. | NO | CHI | 8.7 | 4.1 to 12.2 | |
| RB28 | Kyle Monangai | CHI | NO | 8.4 | 2.9 to 12.5 | Questionable |
| RB29 | Jordan Mason | MIN | SF | 8.3 | 3.0 to 12.4 | |
| RB30 | J.K. Dobbins | DEN | LV | 7.4 | 1.7 to 11.7 | |
| RB31 | Tyjae Spears | TEN | DAL | 7.4 | 3.0 to 10.7 | |
| RB32 | Kenny Gainwell | TB | DET | 7.2 | 3.3 to 10.2 | |
| RB33 | Braelon Allen | NYJ | LAC | 7.2 | 2.0 to 11.2 | |
| RB34 | Justice Hill | BAL | CAR | 7.2 | 3.7 to 9.9 | |
| RB35 | Rico Dowdle | PIT | PHI | 6.8 | 0.9 to 11.3 | |
| RB36 | Alvin Kamara | NO | CHI | 6.7 | 3.3 to 9.2 |
Week 11 RB Film Room FAQ
Should I start Breece Hall in Week 11?
Yes. Breece Hall projects 12.49 points as RB19 against the Chargers and has been startable in 80 percent of his games. He's handed about 59 percent of the Jets' carries, so the floor holds even though he doesn't earn extra yards.
Should I start Jaylen Warren in Week 11?
Yes. Jaylen Warren projects 14.8 points as RB14 and has never scored under 9.1 this season. He's first of 51 backs at rush yards over expected per carry, at 1.76.
Should I start Aaron Jones Sr. in Week 11?
No. Aaron Jones Sr. projects 8.88 points as RB26. He has 35 percent of Minnesota's carries over the last three, down from 52 percent for the season. Sit him unless you're out of options.
How to read this. Rush yards over expected per carry is how many more or fewer yards a back gains than a typical back would. That accounts for the blocking and the defenders. It comes from NFL Next Gen Stats, through Week 10. Share of team carries is the slice of his team's rushes that go to one player. Matchup rank runs from 1, the softest defense against running backs, to 32, the toughest. Roster and start rates come from Sleeper leagues. Weekly ranks blend projections from CBS, ESPN, FanDuel, FleaFlicker and Sleeper.
SEE EVERY WEEK 11 RANKING. FREE.